
📊 How to Read Cryptocurrency Charts: Beginner’s Guide to Technical Analysis
Want to predict crypto price movements like a pro? Learn how to read charts, understand trends, and use basic indicators to make smarter trading decisions.

📈 What Is Technical Analysis?
Technical analysis is the study of price movements and trading volume to forecast future market trends. In simple terms, it helps you make sense of what the market might do next—based on what it’s done before.
Unlike fundamental analysis (which looks at a project’s value, technology, and team), technical analysis focuses entirely on the charts.
💹 Understanding Cryptocurrency Charts
Crypto price charts visualize how the price of a coin or token changes over time. Most exchanges—like Coinbase, Binance, and TradingView—use a candlestick chart format. Each “candle” represents a specific time period (like 1 minute, 1 hour, or 1 day) and shows four key data points:
- Open: The price when the candle started.
- Close: The price when the candle ended.
- High: The highest price during the period.
- Low: The lowest price during the period.
Green (or white) candles show price increases, while red (or black) candles show decreases.
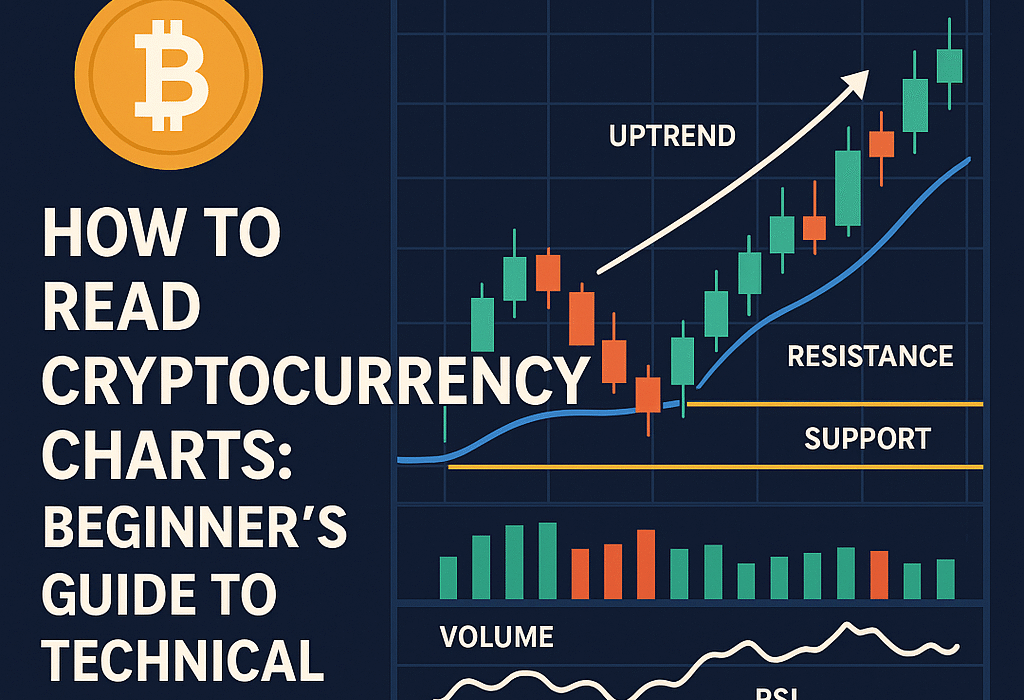
📊 Common Chart Patterns You Should Know
- Uptrend (Bullish): Higher highs and higher lows — prices are steadily rising.
- Downtrend (Bearish): Lower highs and lower lows — prices are falling.
- Support: A price level where buyers often step in to stop prices from falling further.
- Resistance: A price level where selling pressure prevents prices from rising further.
- Breakout: When the price moves above resistance or below support — often signals a strong new move.
⚙️ Key Technical Indicators for Beginners
- Moving Average (MA): Smooths out price data to show overall direction.
- Relative Strength Index (RSI): Measures if an asset is overbought (above 70) or oversold (below 30).
- MACD (Moving Average Convergence Divergence): Helps identify trend direction and potential reversals.
- Volume: Shows how much of an asset is being traded—higher volume often confirms strong trends.
🧠 Pro Tips for Reading Charts
- Always check multiple timeframes (1-hour, 4-hour, daily) before making a trade.
- Combine indicators—don’t rely on just one.
- Look for confirmation before acting on a pattern or signal.
- Practice with demo accounts to build confidence.
💬 Final Thoughts
Reading cryptocurrency charts might seem complicated at first, but with practice, it becomes second nature. Start with basic patterns, watch how markets react, and soon you’ll recognize trends before they happen.
Remember: No analysis is 100% accurate, but understanding technical analysis gives you a real edge in the crypto world.